


A Review of Corrective Market Patterns
Are we in a Correction - or not?

Premise:

Following a major Correction and once price recovers to its pre-Correction High, the market will typically extend another 61% or more higher (161% of the move from the Correction Low back to the pre-Correction High).

And on exceeding that level, it will eventually correct down again, retracing 38%-61% of the move back towards the 1st Correction’s low.

Then the process will begin again.
In March, 2020, the market corrected to a low of SPX 2191.86; then it reversed and eventually recovered the February, 2020 pre-Correction High of 3393.52. On reaching that level, it worked its way higher to eventually reach the 161% extension of that move from 2191 to 3393, to reach 4136.15 last April. It subsequently climbed to a high of 4818.62 (above the 200% extension) in early January of this year.
Assuming the pattern - correct to a Low, regain the High, extend, top out, and retrace towards that Low - is repeating as it has in the past, we can project a potential Correction target range of 3195-3815:
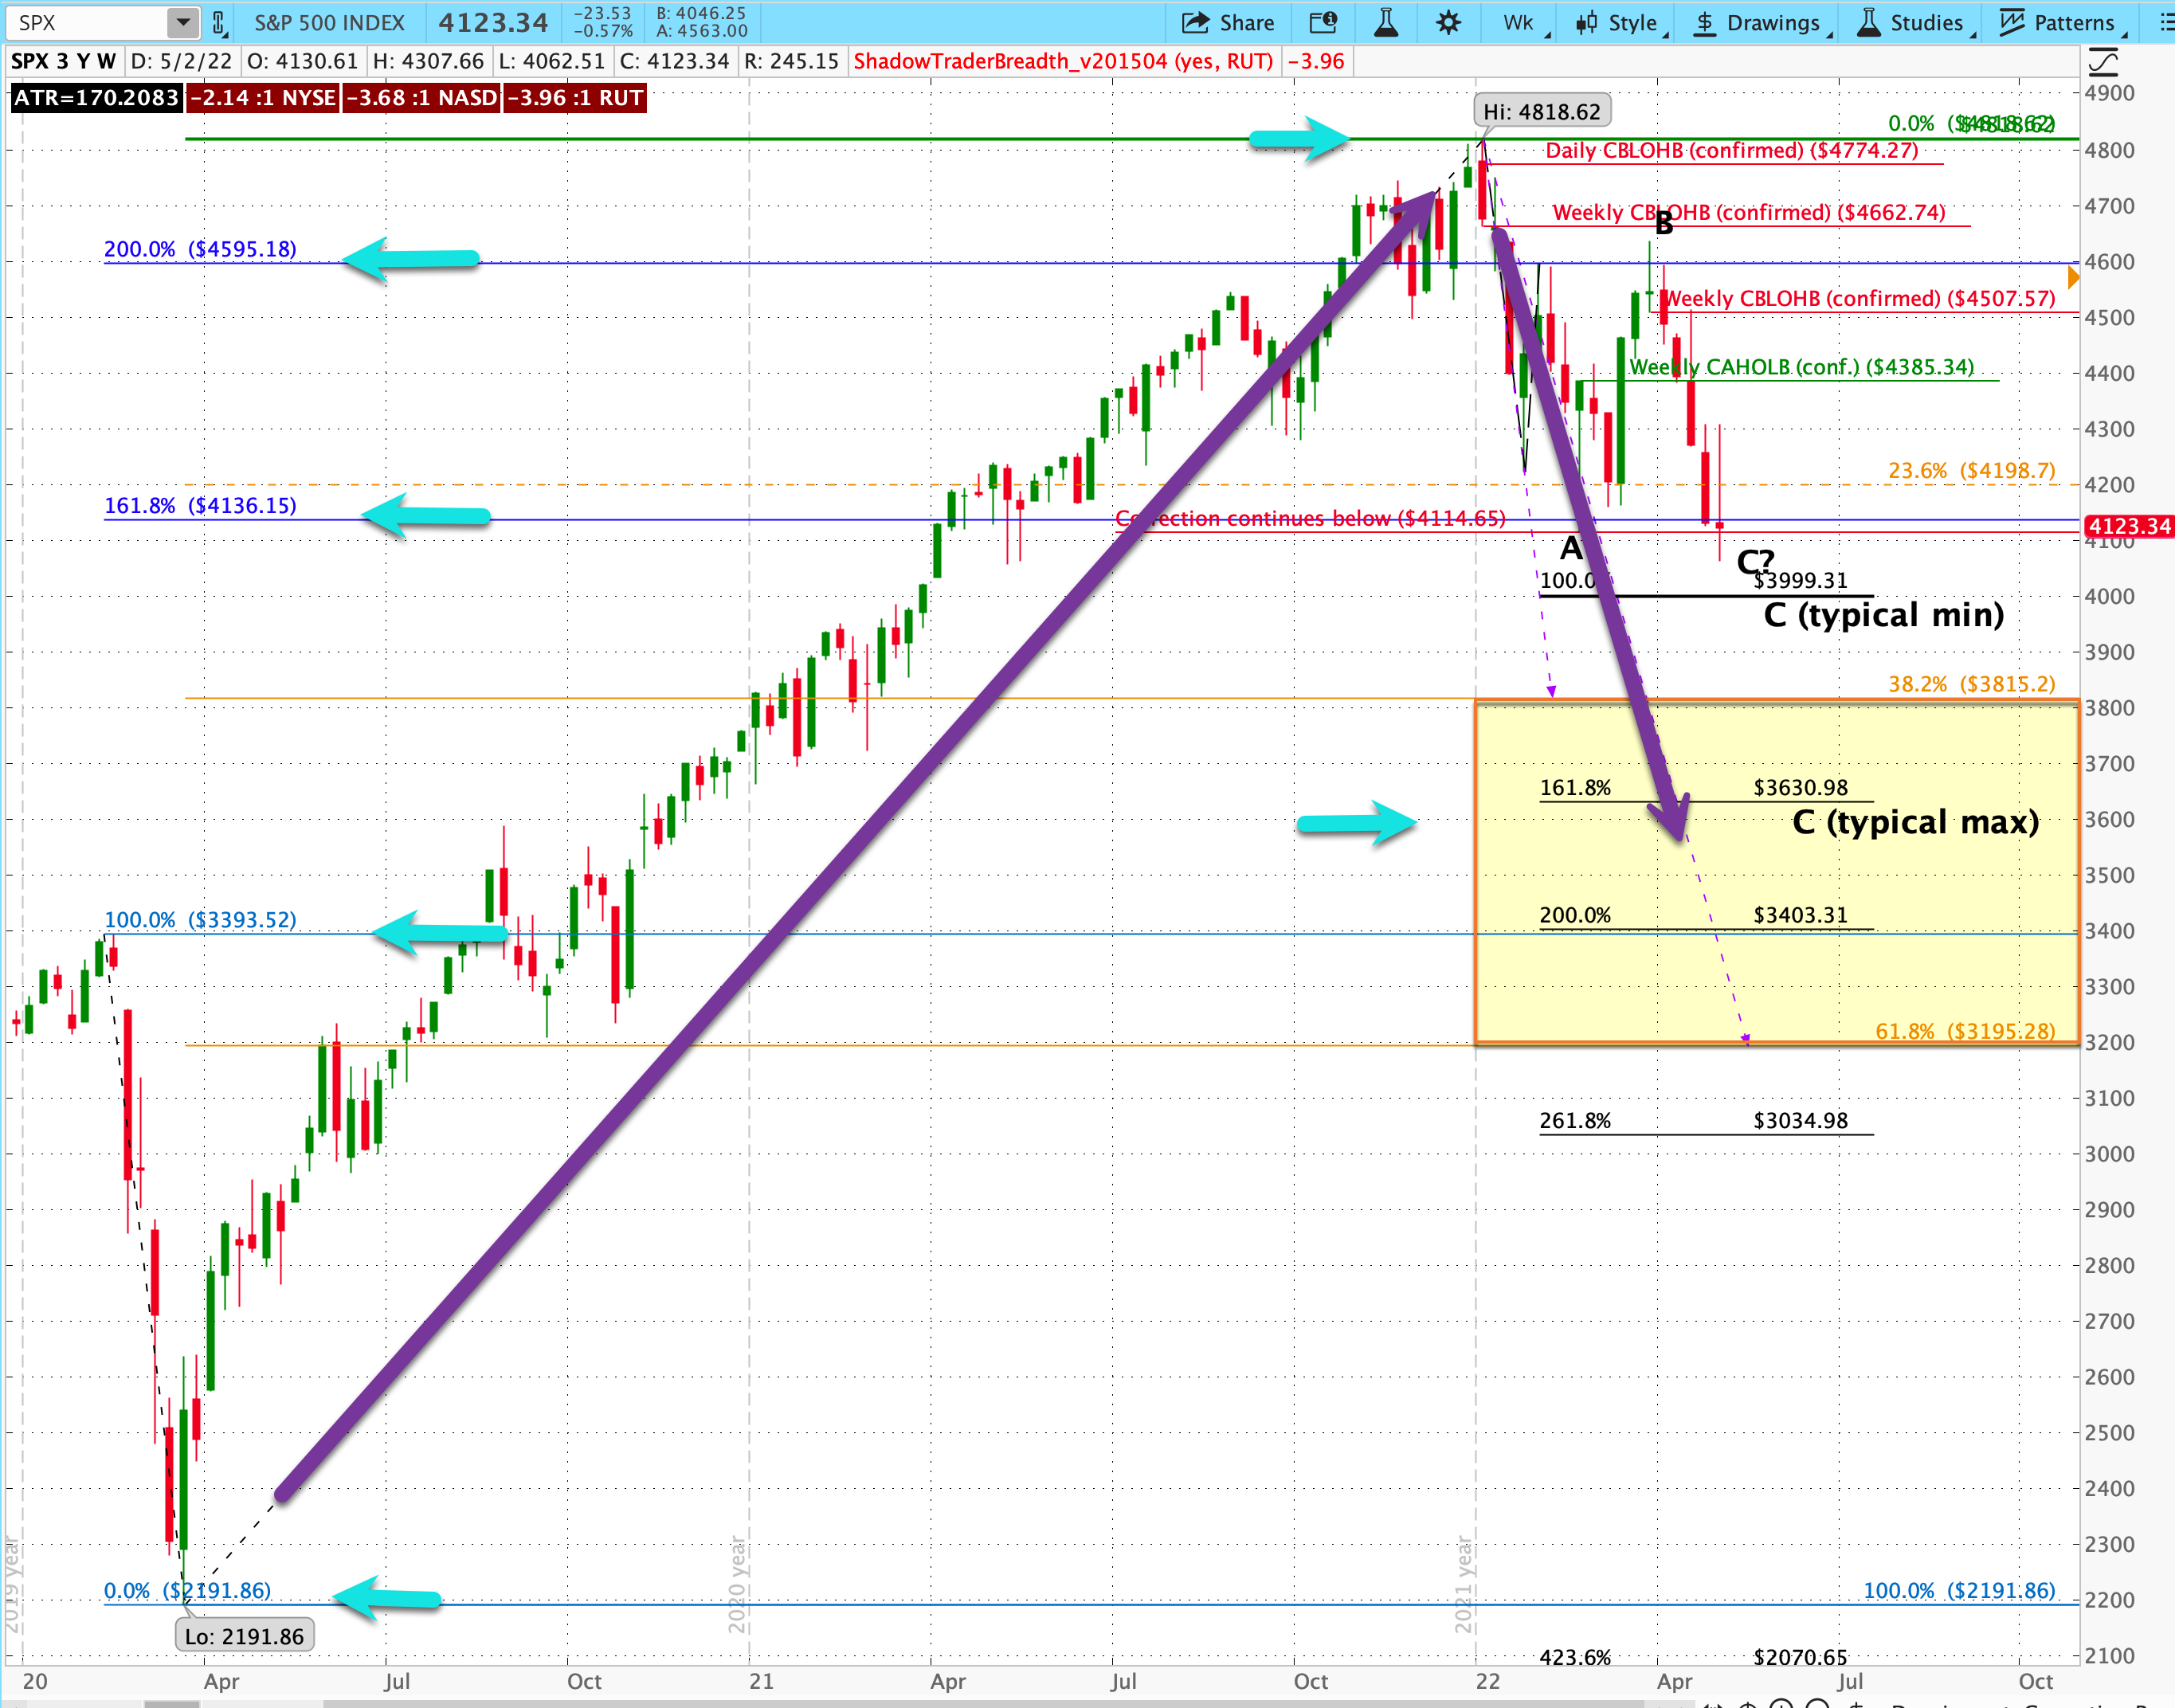
Corrective patterns are typically 3-legged (a down leg, an up leg, and a final down leg, labeled “ABC”), where the C leg typically is at least the length of the A leg, to be at least C = A (or even C >= A). A common occurrence is for the C leg to extend 1.61 times the length of A (C >= A*1.618).
Accordingly, the structure of the current Correction appears to be an ABC down pattern, where: A concluded the week of February 21st at 4114.65, and B concluded the week of March 28th at 4637.3.
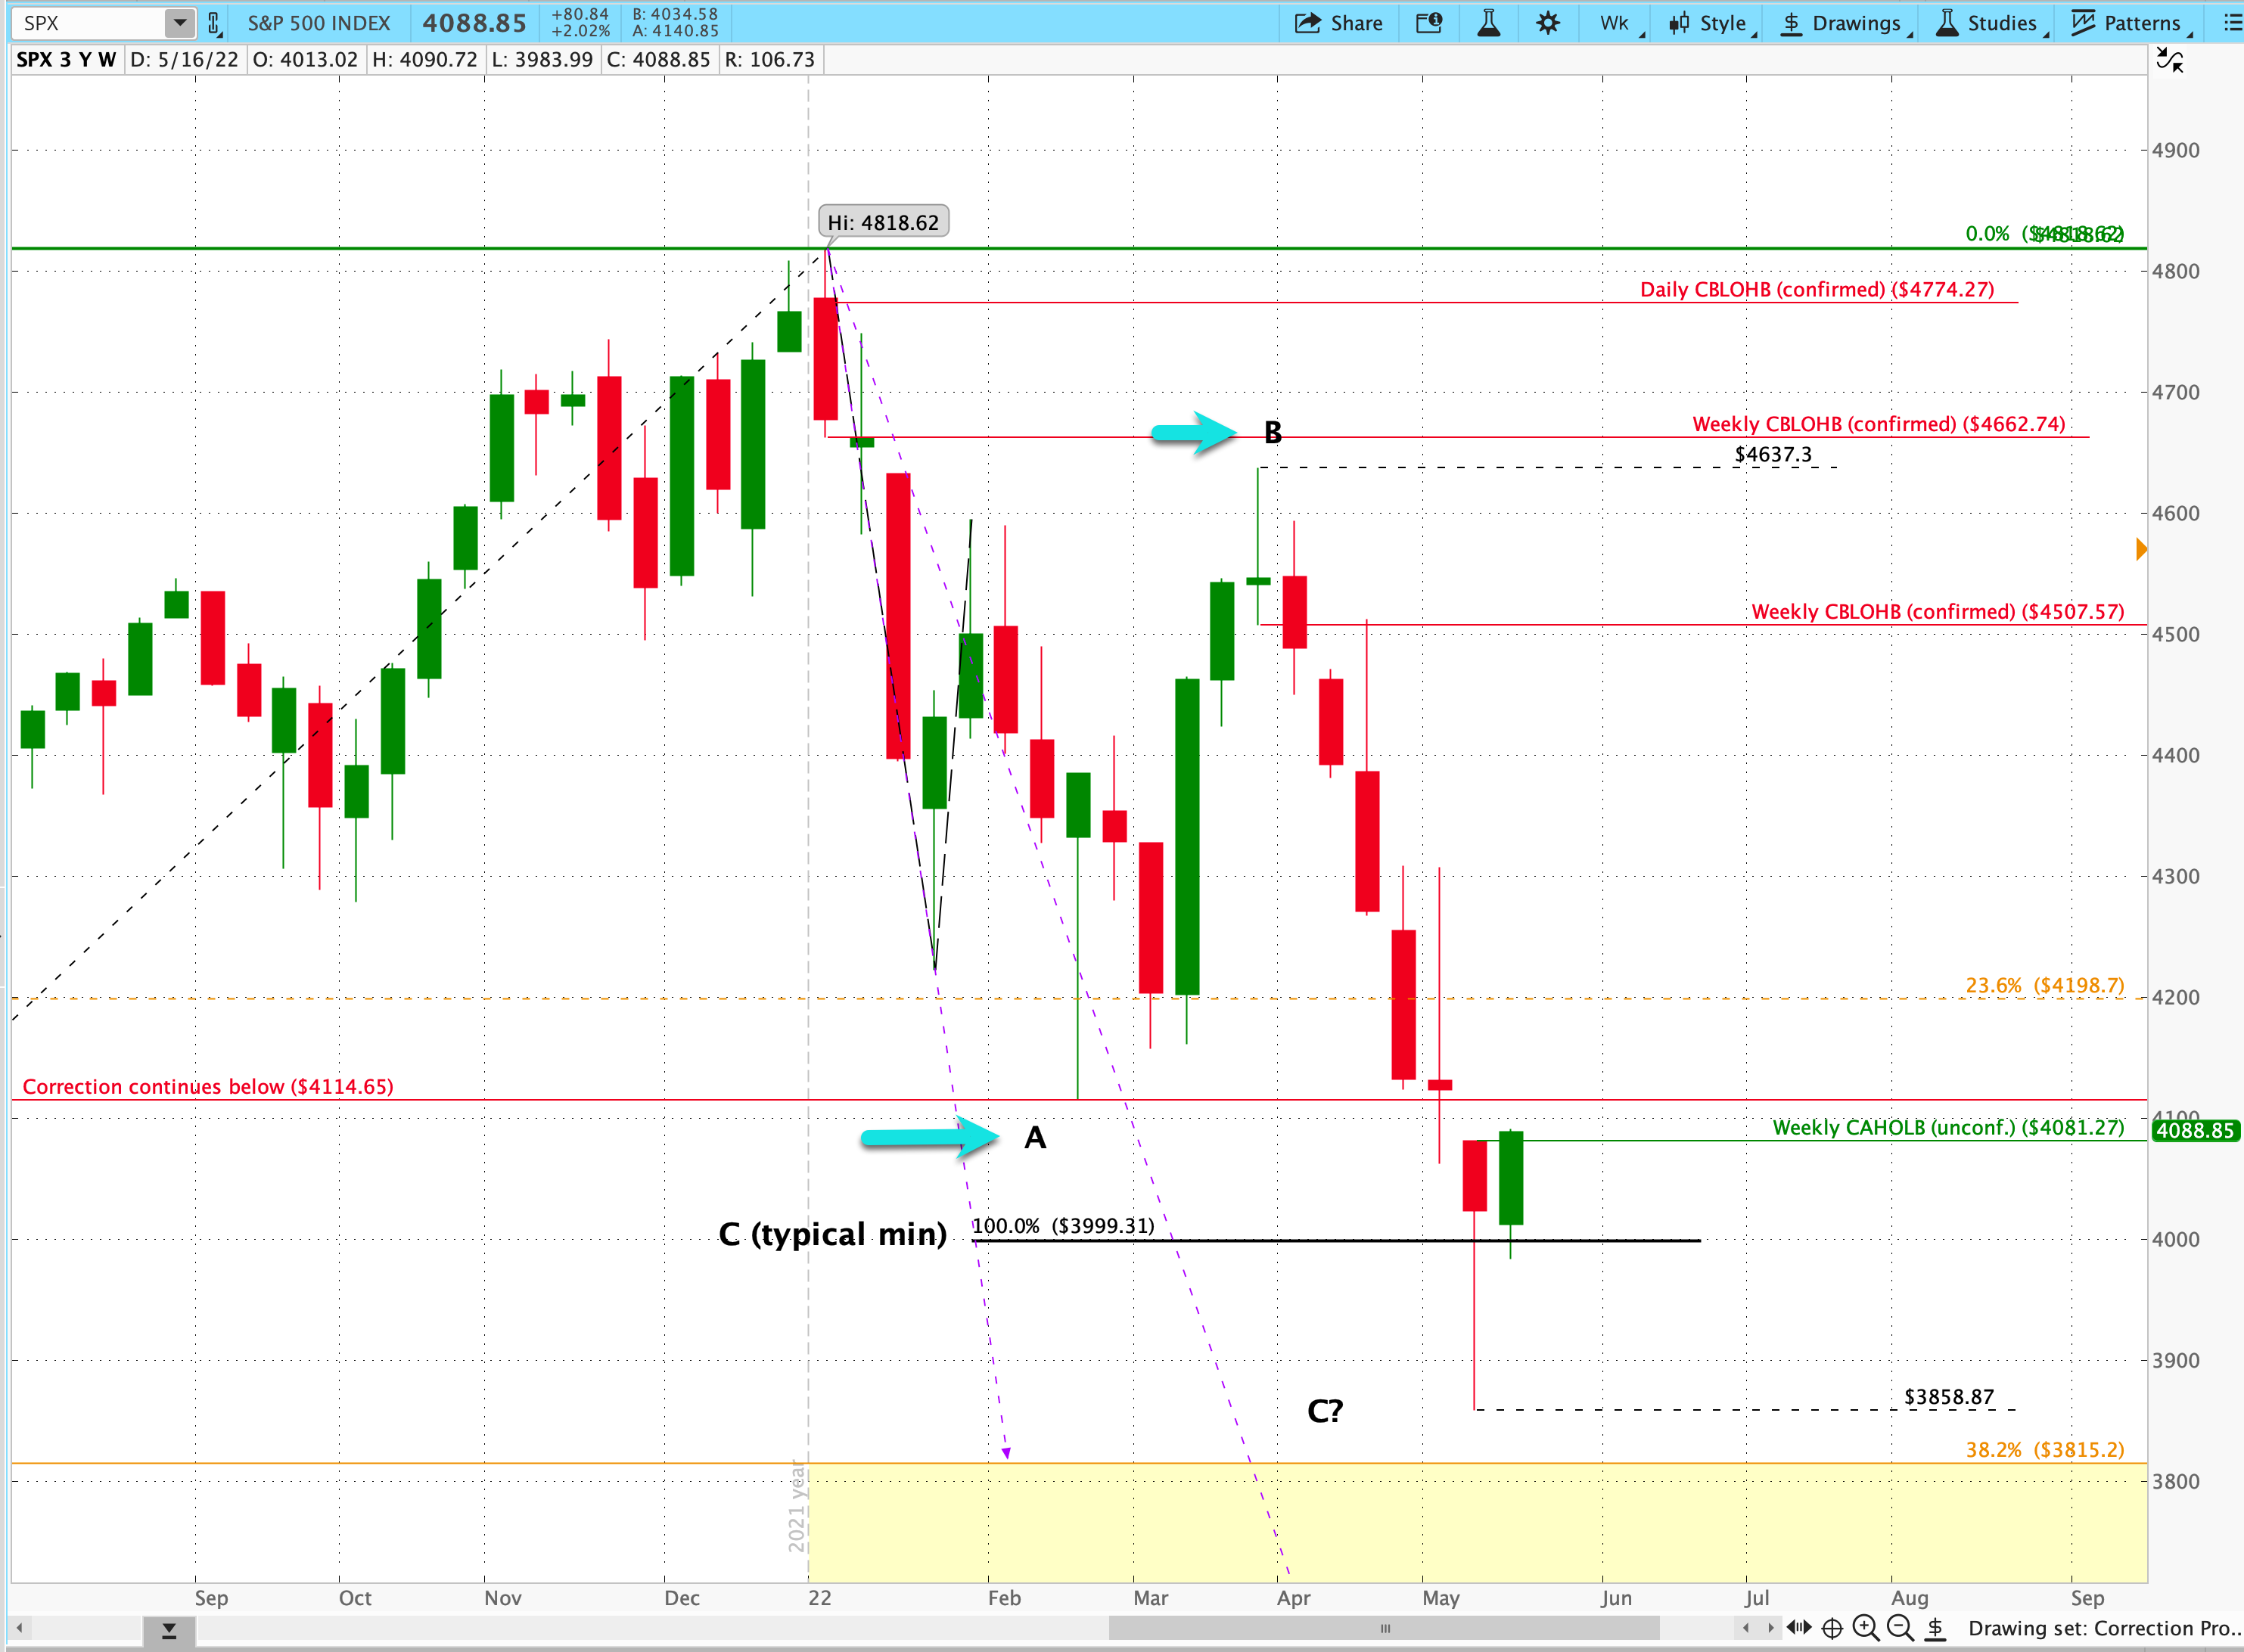
Update (5/17/2022): as of last week, the Correction had reached a low of SPX 3858.87, just 43pts shy of the 38% retrace, and well past 3999, the minimum requirement for C, where the length of C is equal to A (C=A).
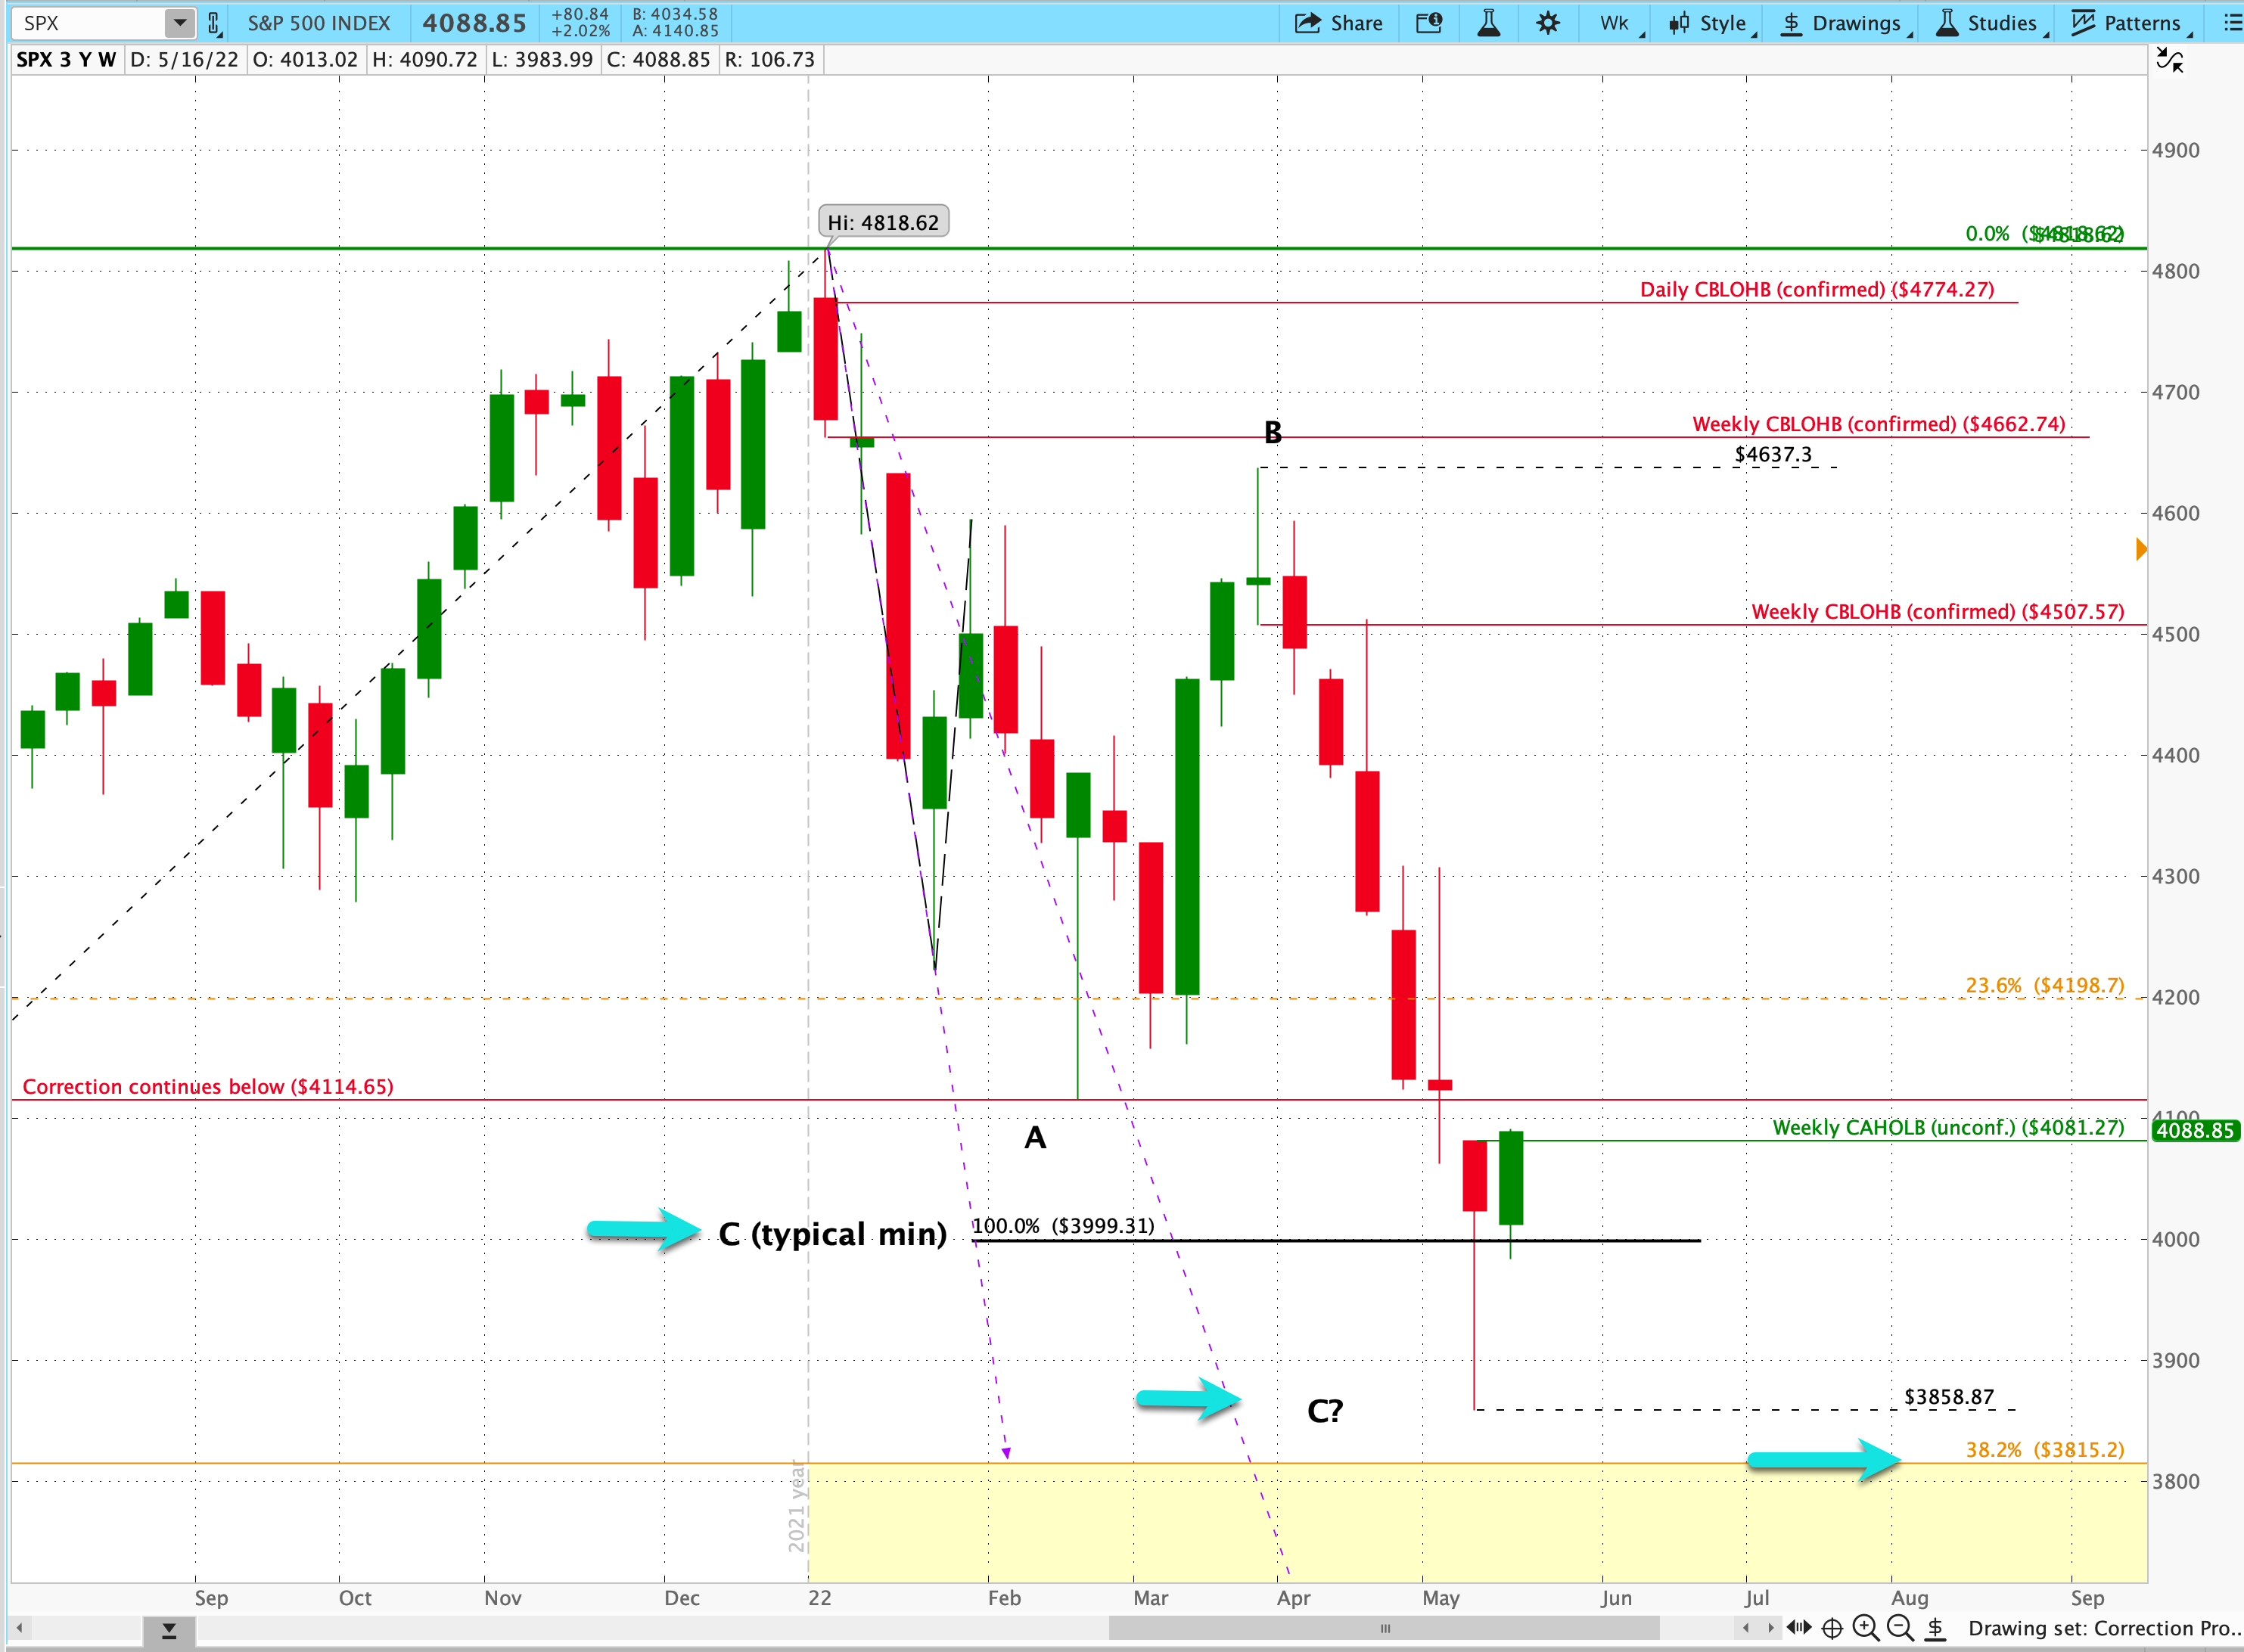
While it’s so far entirely possible that it will reverse and head lower, we’re starting to see evidence that 3858.87 may have been the bottom of the Correction. We’ll know with higher certainty over the next few weeks if the probabilities begin to shift in favor of that outcome.
Update (6/26/2022): as of last week, the Correction had reached a low of SPX 3636.87, 180pts below the 38% retrace, and well past 3999, the minimum requirement for C (where the length of C is equal to A, or C=A). Indeed, it has extended to where C=A*1.38, a very respectable and typical extension.
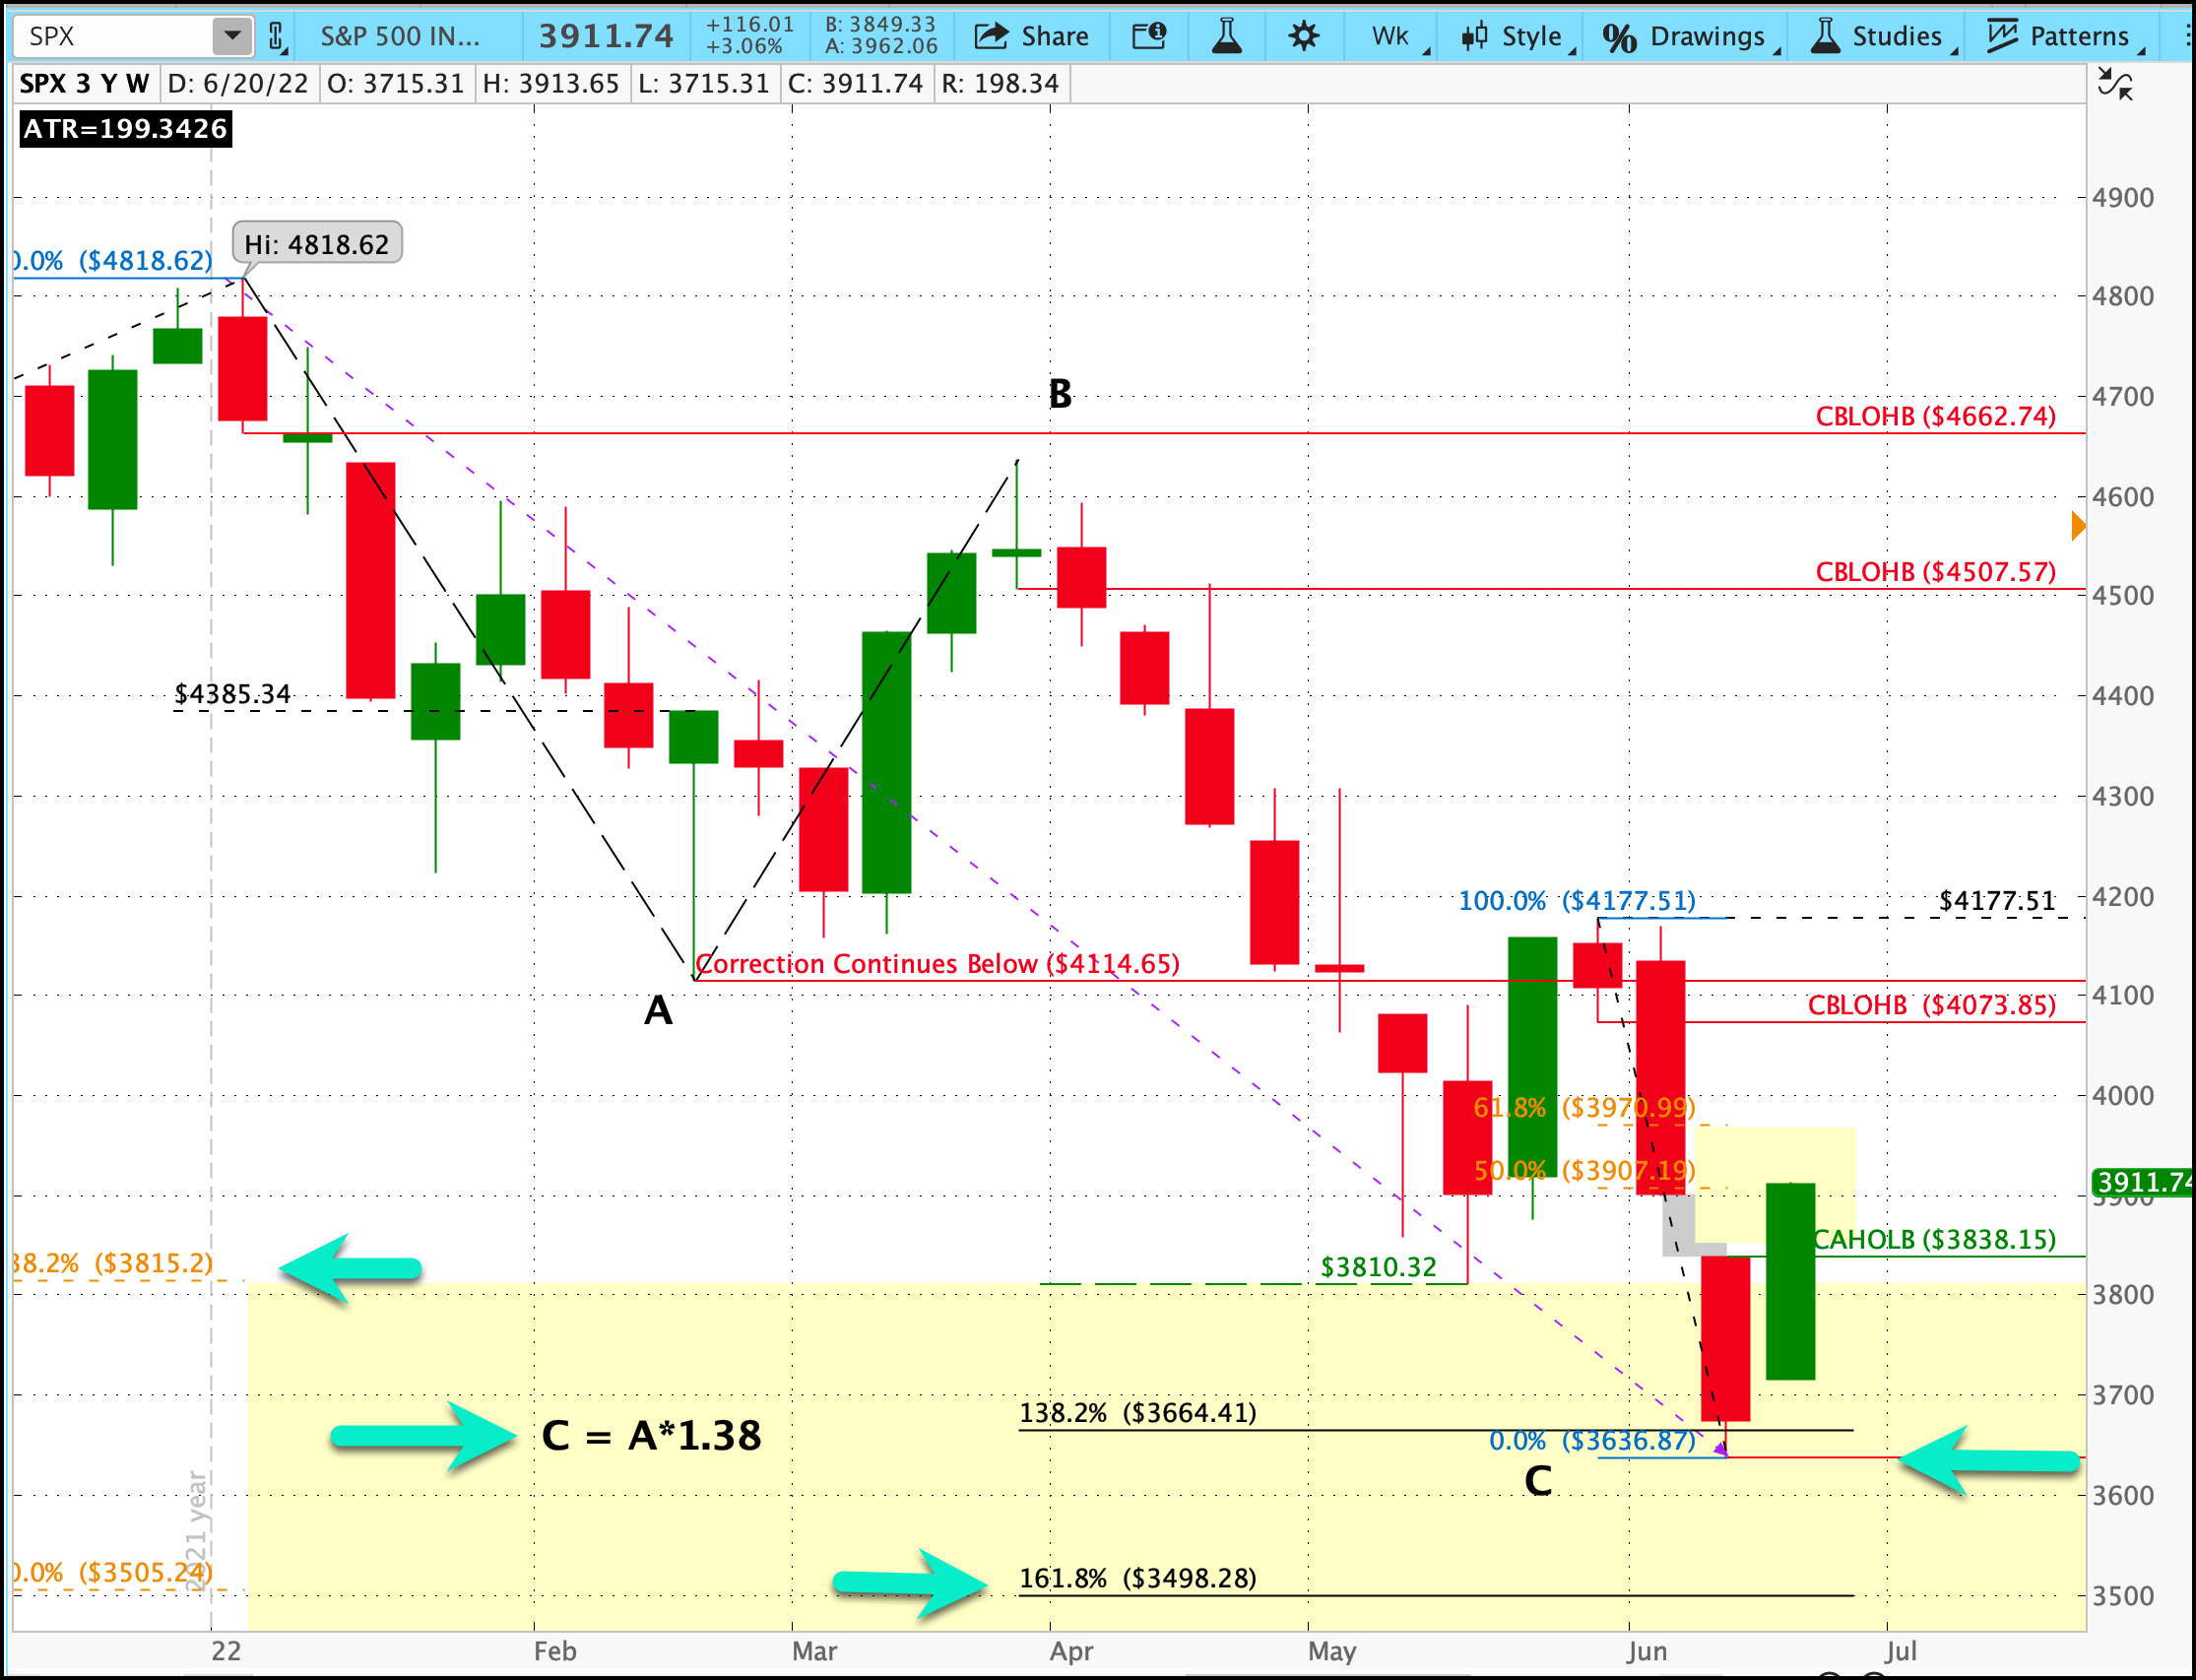
In summary, SPX has met two key requirements for the Correction to end:
The length of the C leg now exceeds that of the A leg
It has retraced over 38% from the January 2022 All Time High back towards the March 2020 Correction Lows.
If it breaches 3636.87, it will likely reach the next Fib level, 1.618%, around 3500. But we can now start looking for evidence that the Correction may have ended, and whether the market is building a price structure that’s sustainable for higher prices in the longer term.