Fibonacci Pinball
The correction continues and targets 4456

On Sept 2nd, SPX produced a new All Time High (ATH) of 4545.85, and then fell to the low of 10/4, the start of the rally that ended last week. On Oct 21, the rally re-took and broke above that previous ATH on its way to last week’s ATH of 4743.83. Today, SPX broke back through 4545.85 on it’s way back down.
The move up above 4545.85 triggered a classic pattern where, after a price decline and a bounce back to a former high, price continues higher to reach the 1.61% extension of the retrace to the former high. SPX reached that extension, 4710.8, on 11/5, and over the subsequent weeks tried - and failed - to close above it. As projected last week, it’s now likely to retrace 61% of the rally up from 4278.94, just as it extended 61% above the old ATH.
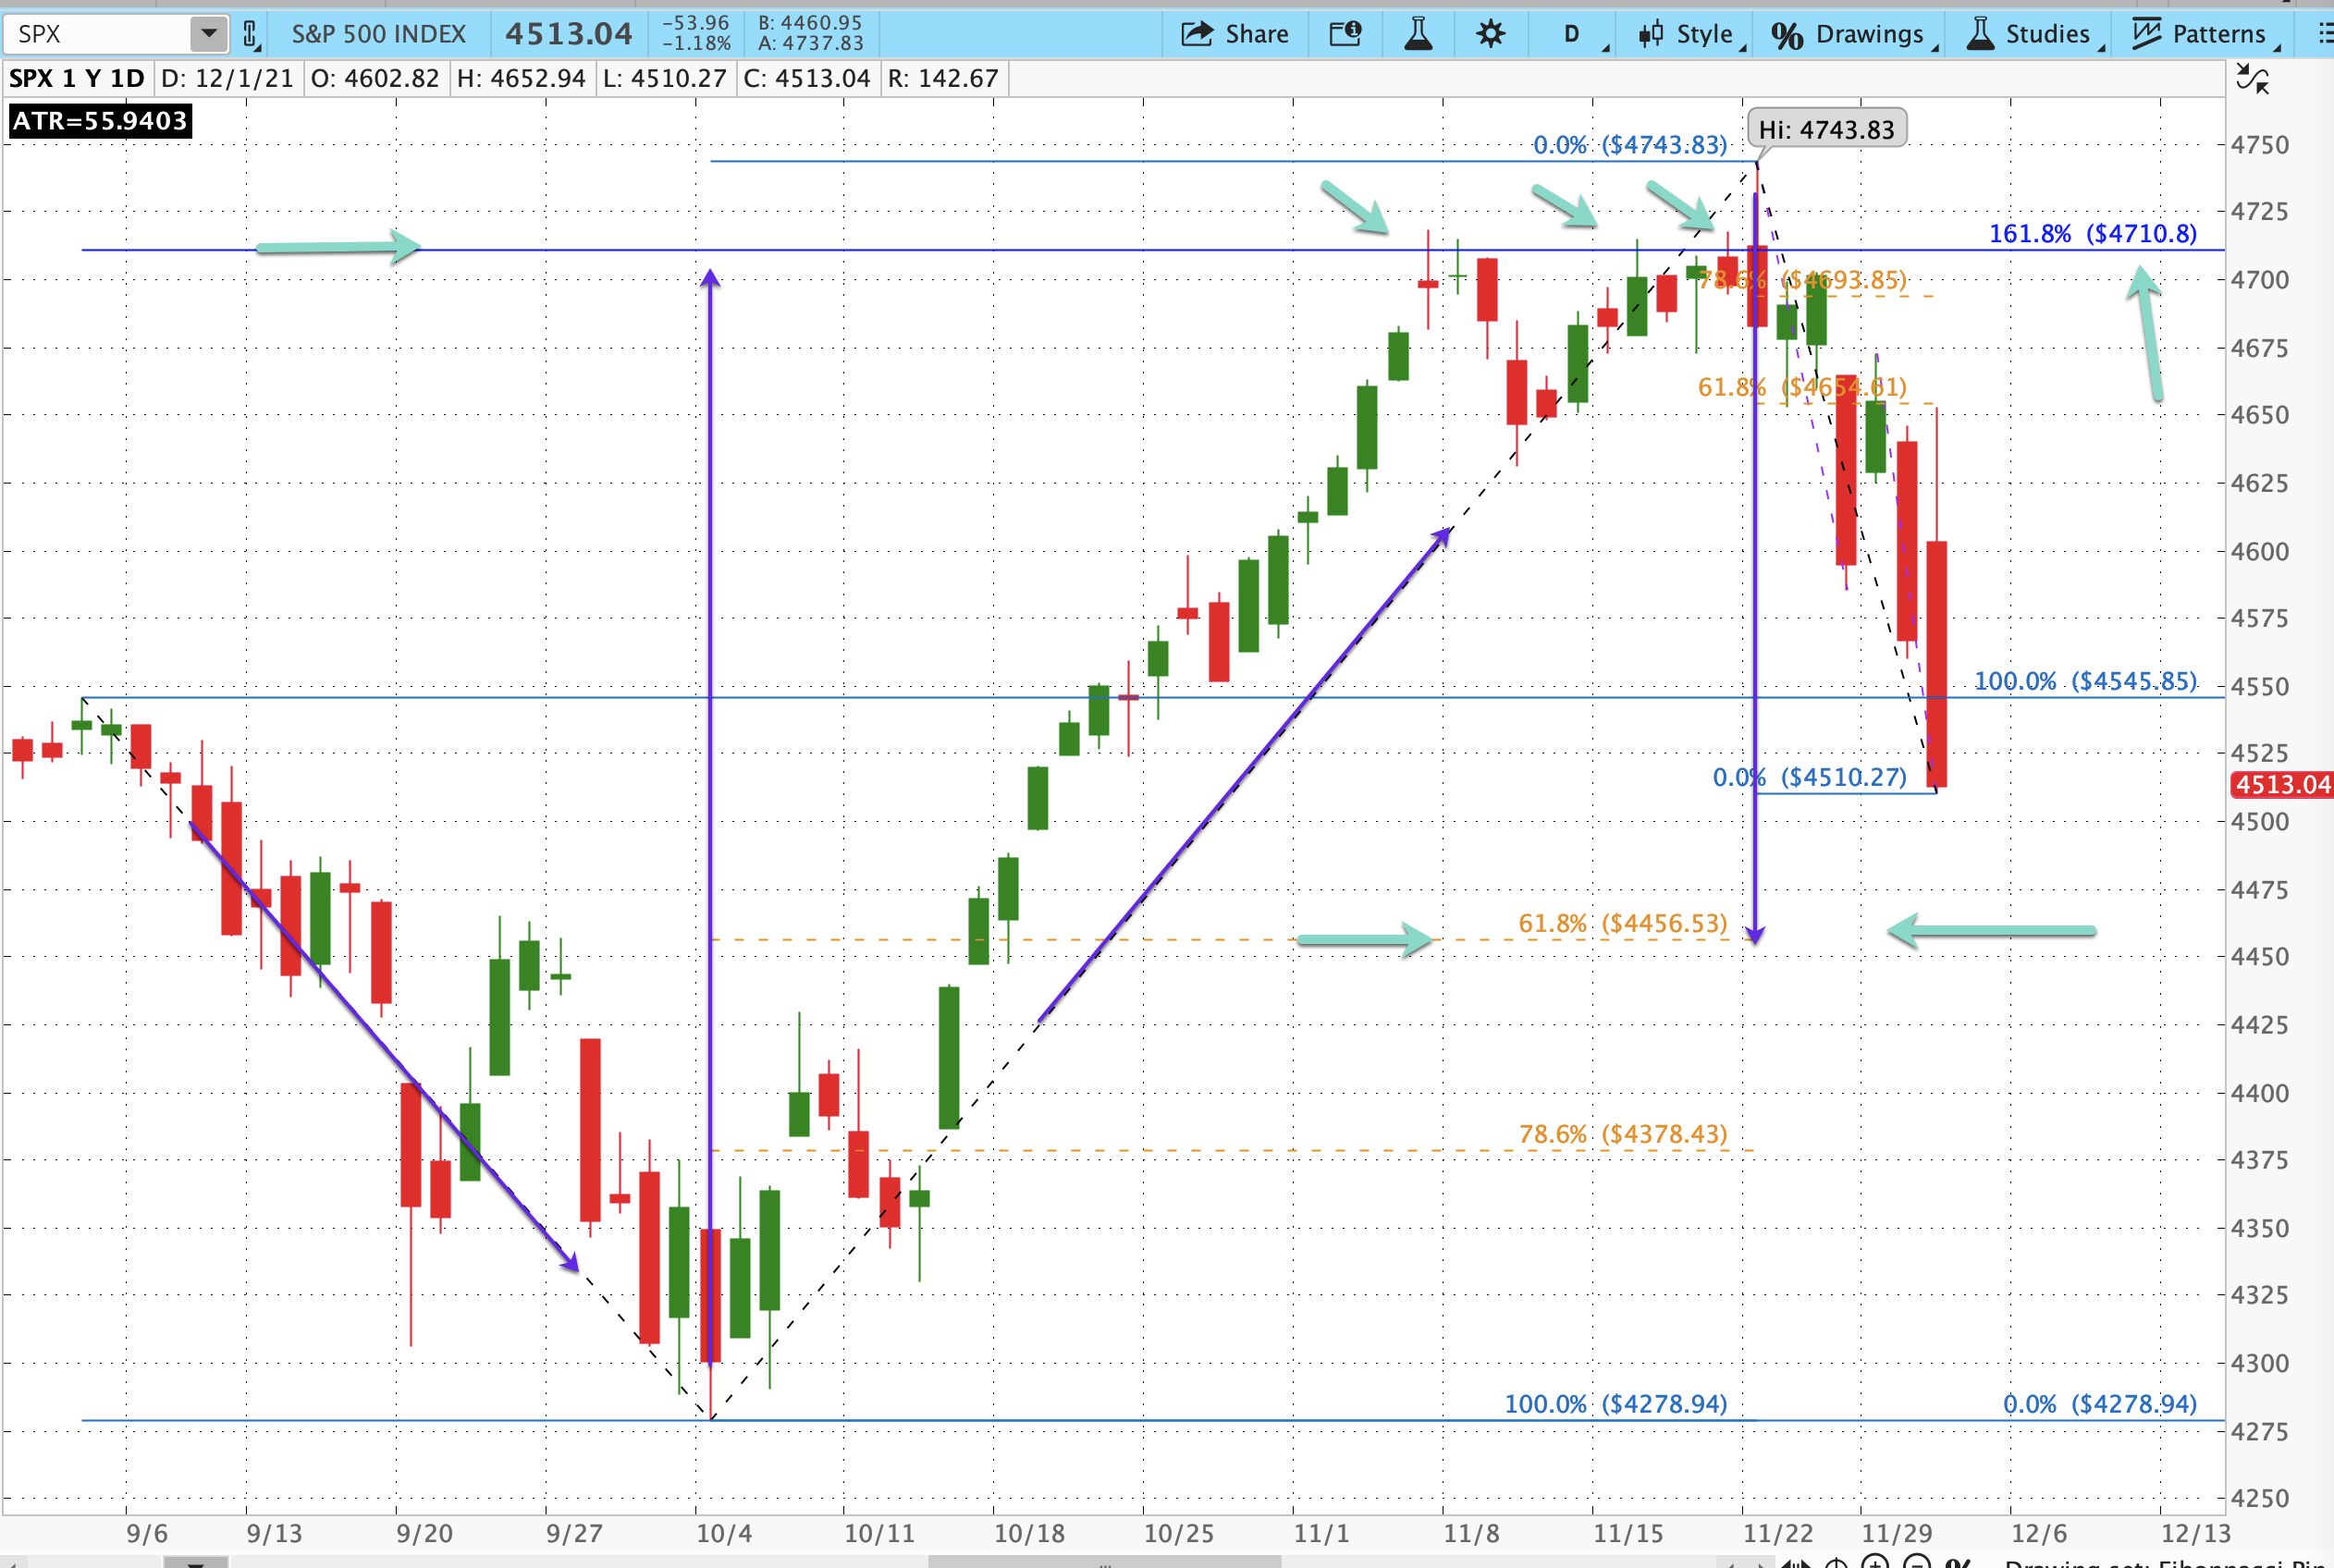
No guarantees, but it’s now even more likely that that level, 4456, is the next target of the correction.
All along, this was projected as a correction that would retrace 38-61% of the 10/4-11/22 rally, and we’re now squarely in that retrace target zone.
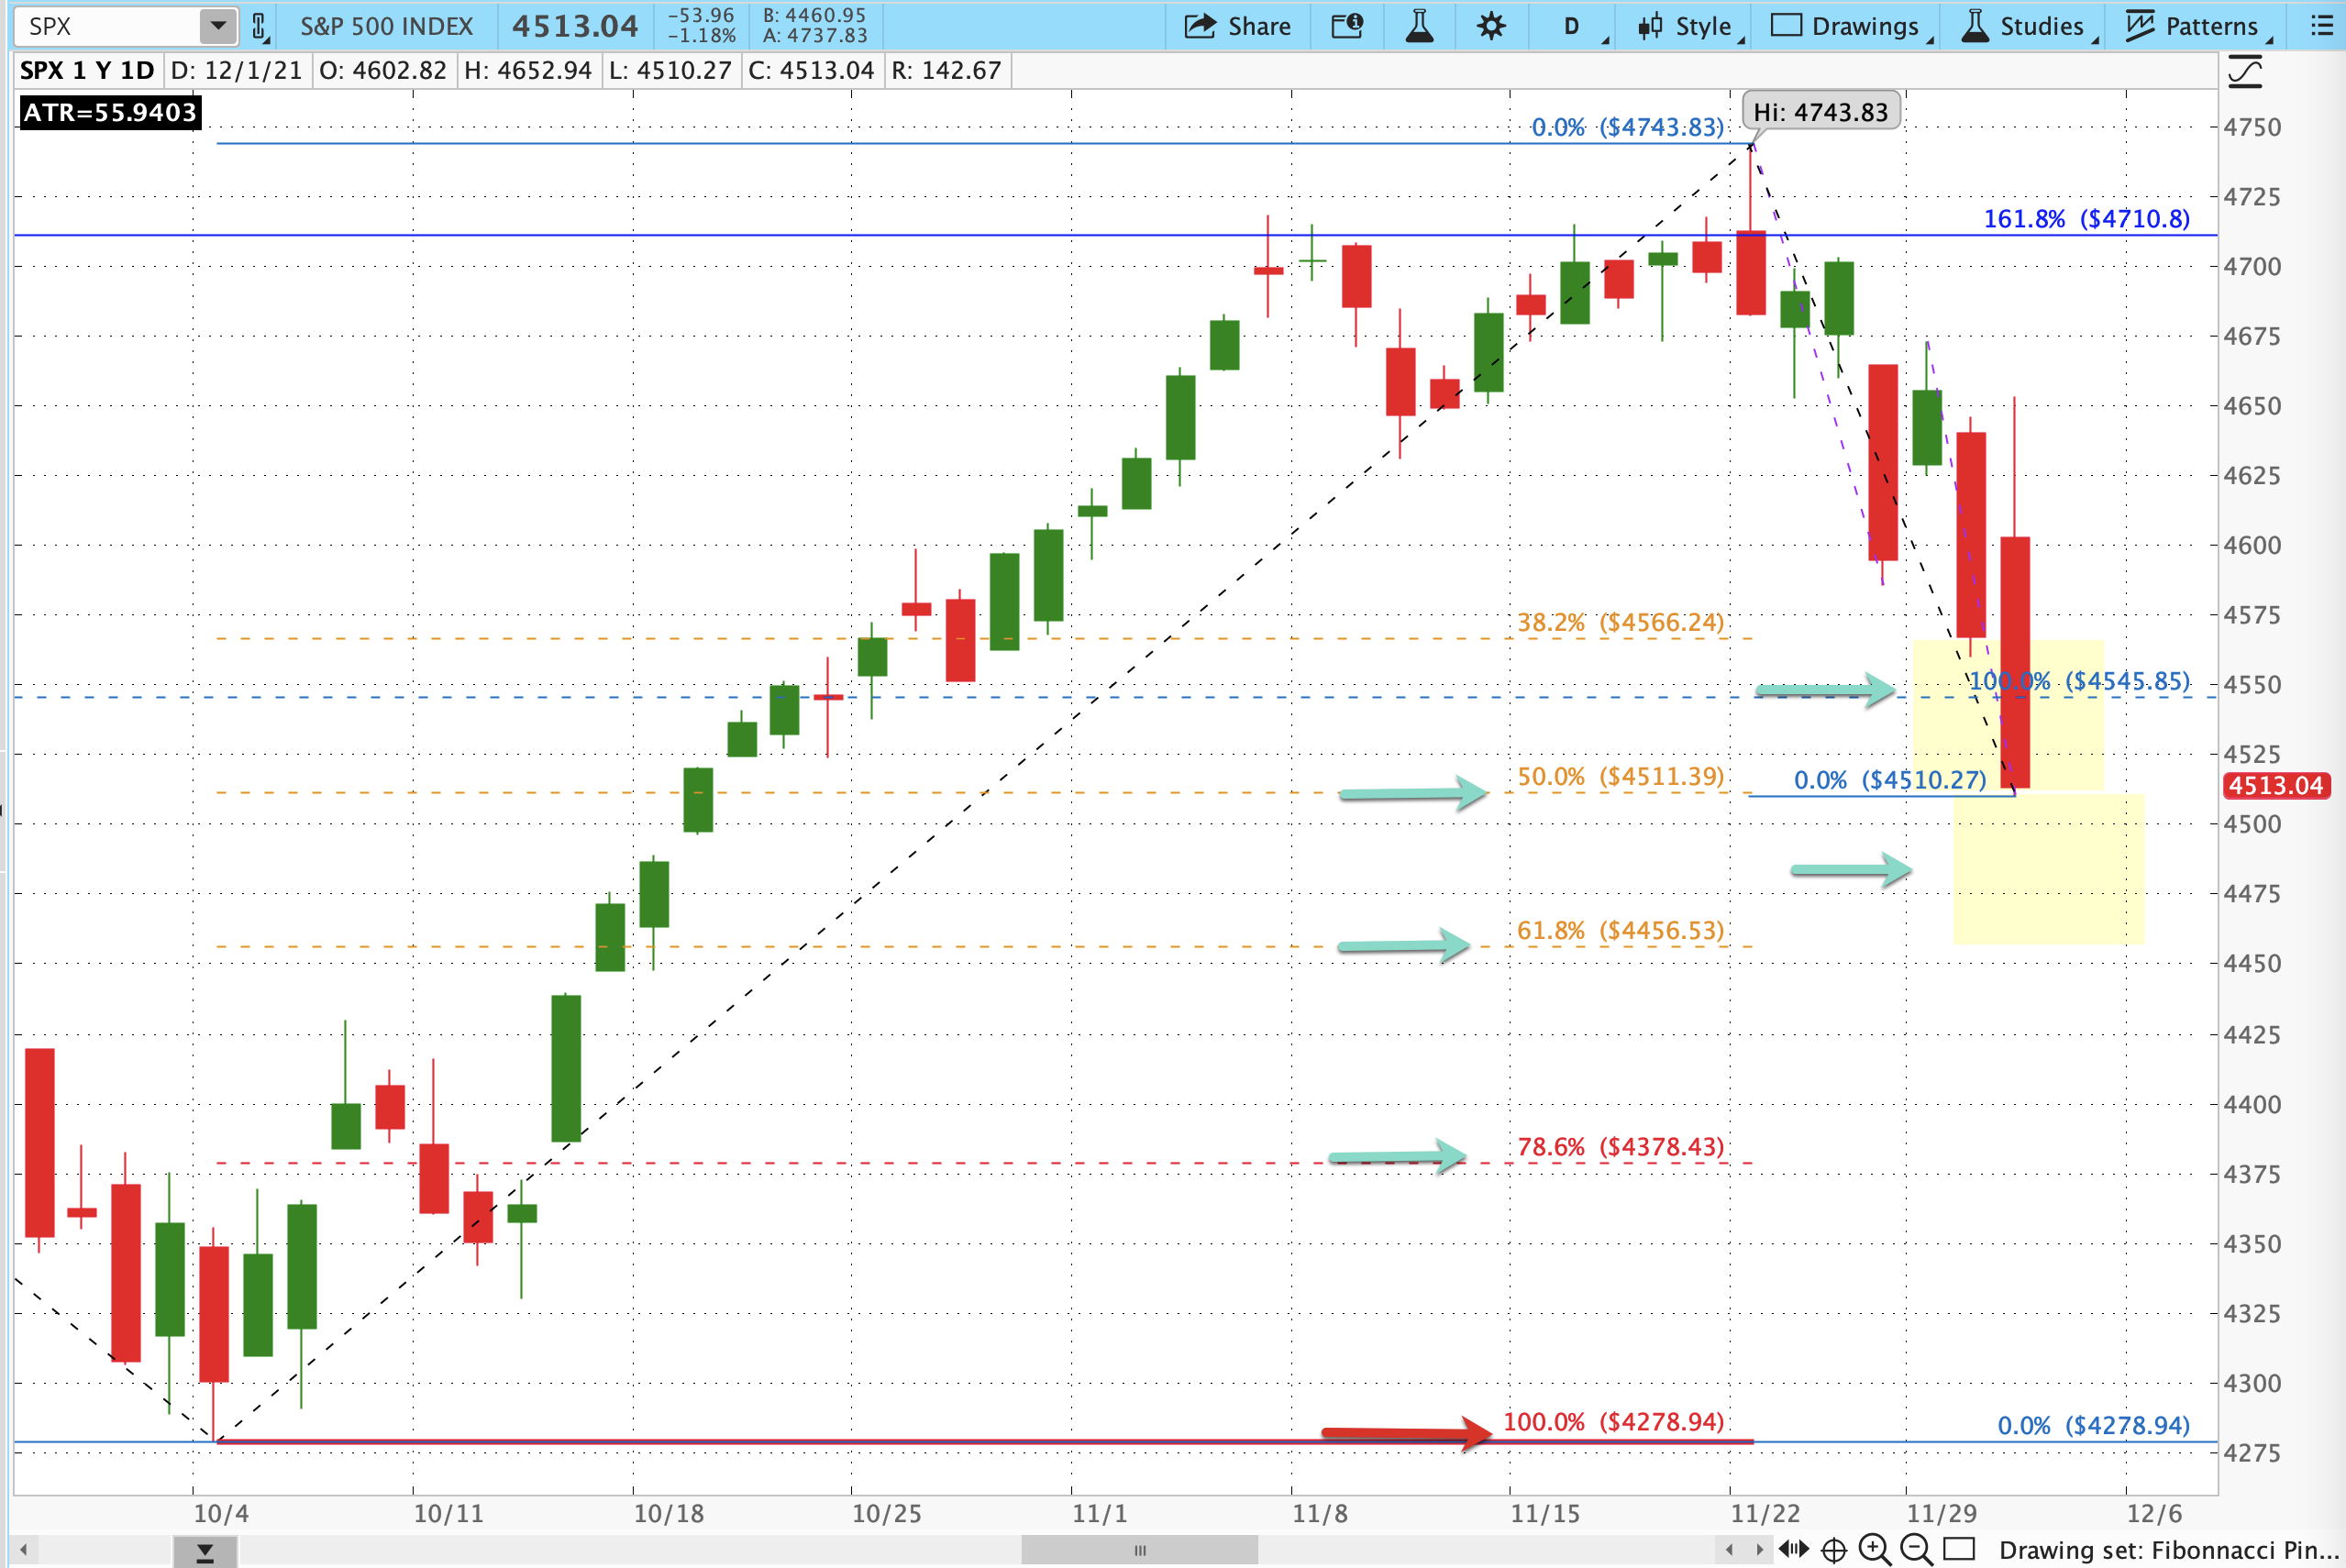
Note that as long as price is able to break a given level of support, it’s most likely to continue, to at least test the next level of support below. (The same is true in reverse with market rallies breaking through layers of resistance.) So if price breaks down to - and exceeds - 4456, it could continue on to test 4378. Note that if that level is tested, the probability of price testing the 10/4 Low of 4278 is extremely high - and it’s worth a warning because if that level gave way, we’re looking at a much, much deeper correction than was originally forecast.
For now, however, it’s best to stay focused on the current levels:
If 4510 holds, look for the start of bounce and perhaps the end of the correction.
If 4510 breaks, look for a test of 4456.
If 4456 is tested and fails, look for a test of 4378, etc.
Finally, there’s the ABC down pattern, best illustrated with an intraday chart.
The classical ABC calls for C to be at least the length of A, and possibly longer. The A leg was -158.4pts, and as of today, the C leg is -218pts. When C exceeds A, it will typically do so in some Fibonacci multiple. So once C went below 4514.55 today, the next likely extension would be A*1.382 or 218.90. That suggests that C could end between 4514.55 and 4454.04 (the end of B/start of C at 4672.95 minus 218.90).
Call it 4455: it’s close enough for Jazz or Blues.
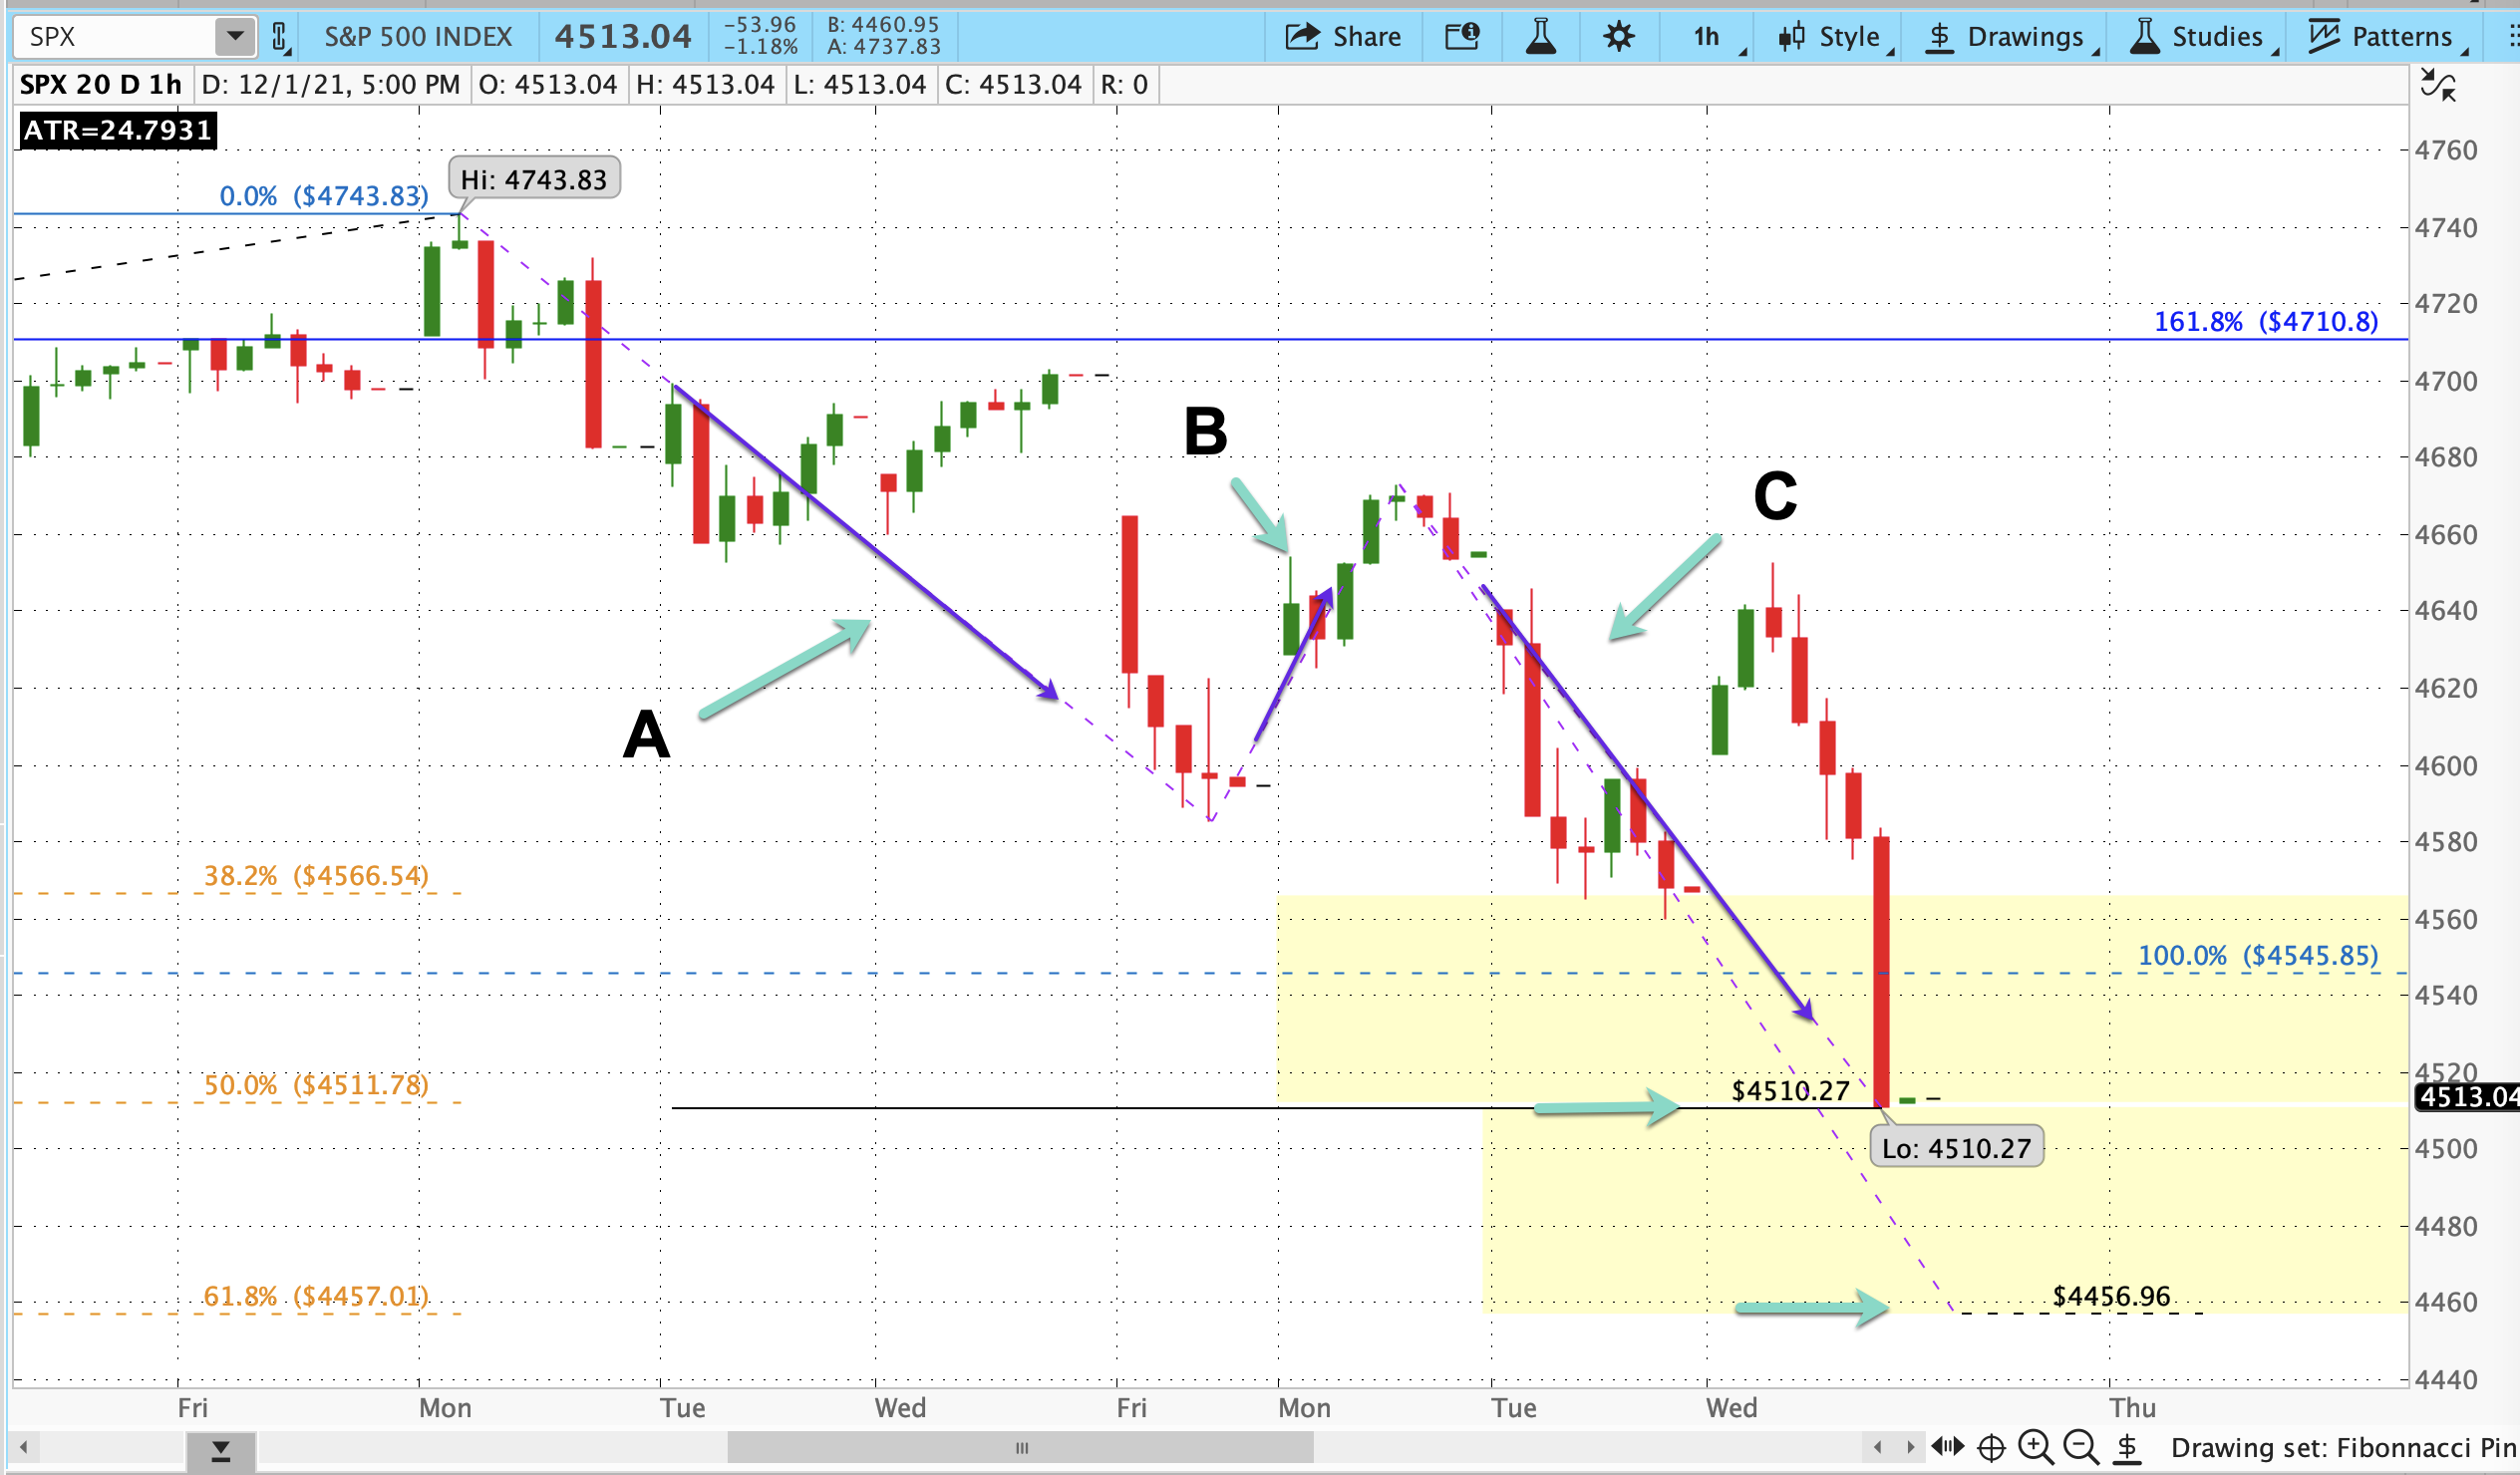
The correction doesn’t have to end at 4455. But both the correction and the rally before it have met technical expectations very nicely (suggesting technical traders are influencing, if not making, the decisions at key levels). So for now, we can assume that any further push down will likely end between here and 4455, and if price exceeds that level, we’ll simply re-calibrate to the next level below.
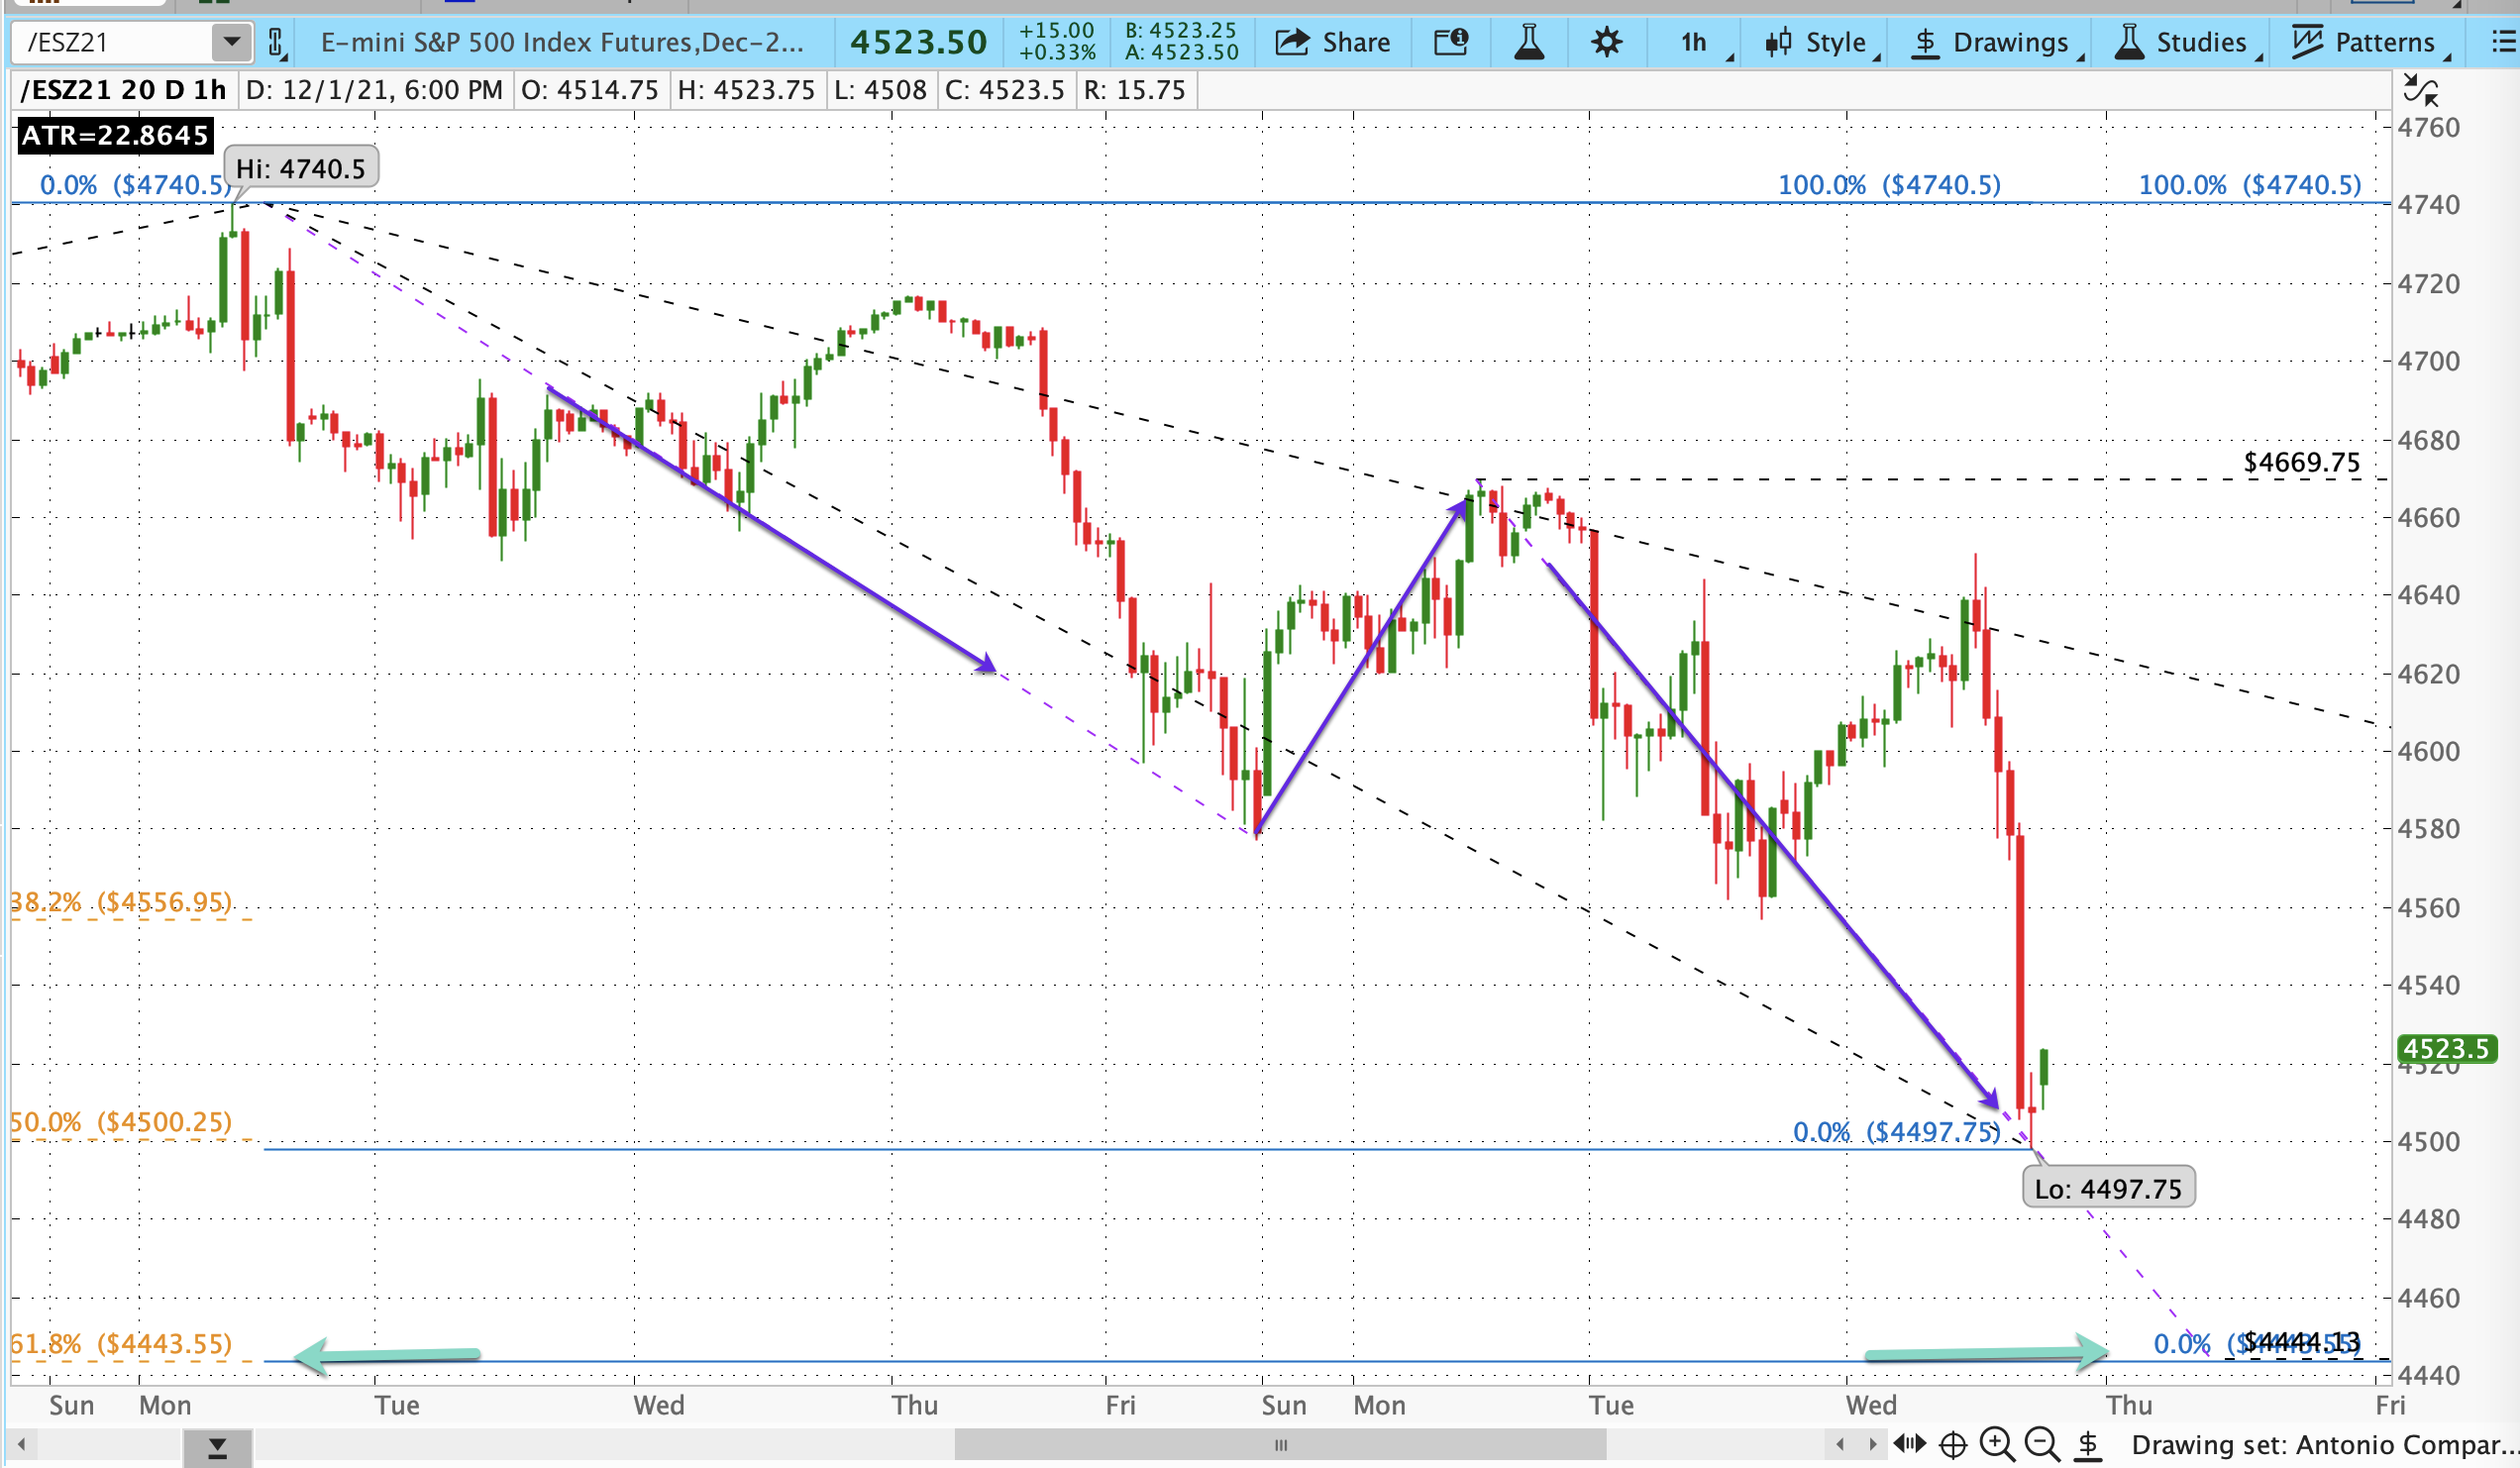
Similarly for ES, the ABC:
A was -163.25
A*1.382 = -225.61
That suggests the next segment to watch for C is between today’s Low and 4444.13, almost exactly the 61.8% retrace of the move up from 10/1-11/22.